Edit chart
Loading graph
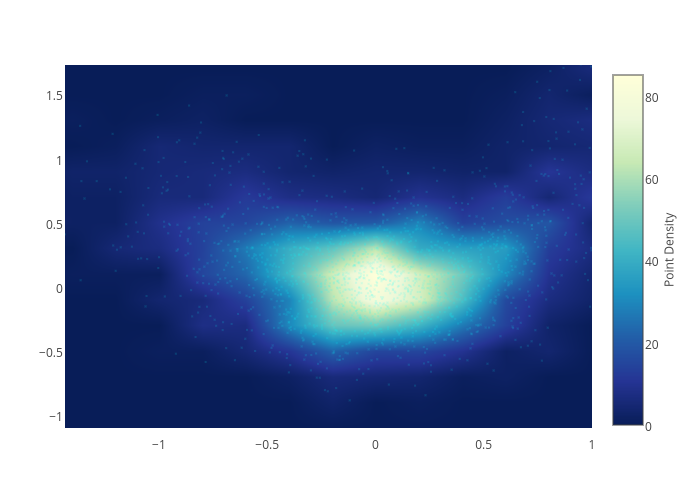
Chris's interactive graph and data of "points vs density" is a scatter chart, showing points vs density. The x-axis shows values from -1.4344434701465842 to 0.9997814589117826. The y-axis shows values from -1.1557003332123332 to 1.7293480115708415.