Edit chart
Loading graph
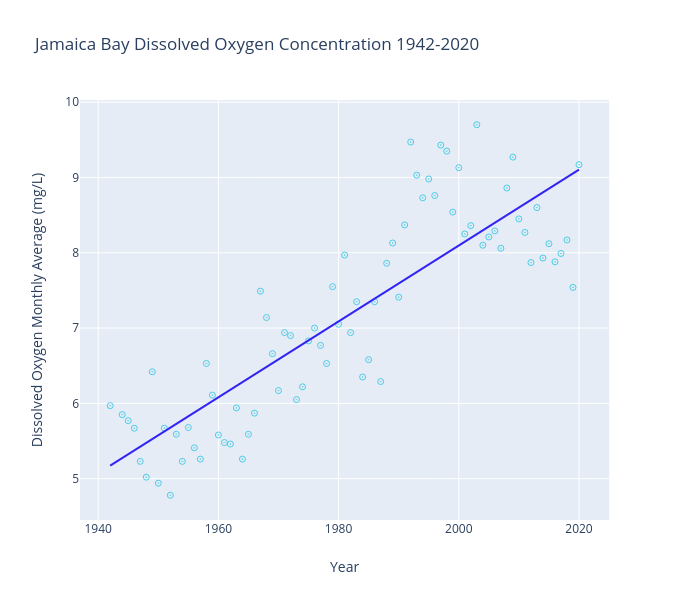
Chelleorc's interactive graph and data of "Jamaica Bay Dissolved Oxygen Concentration 1942-2020" is a scatter chart, showing vs ; with Year in the x-axis and Dissolved Oxygen Monthly Average (mg/L) in the y-axis.. The x-axis shows values from 1937.2601778544895 to 2024.7398221455105. The y-axis shows values from 4.451336032388665 to 10.028663967611335.