Edit chart
Loading graph
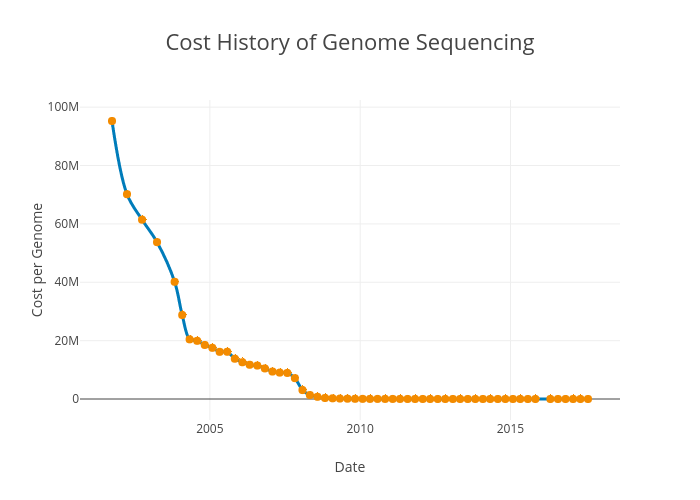
Cford38's interactive graph and data of "Cost History of Genome Sequencing" is a line chart, showing Cost per Genome; with Date in the x-axis and Cost per Genome in the y-axis.. The x-axis shows values from 2000-10-05 03:00:57.0879 to 2018-07-25 20:59:02.9121. The y-axis shows values from -6675300.710251046 to 101939387.71025105.