Edit chart
Loading graph
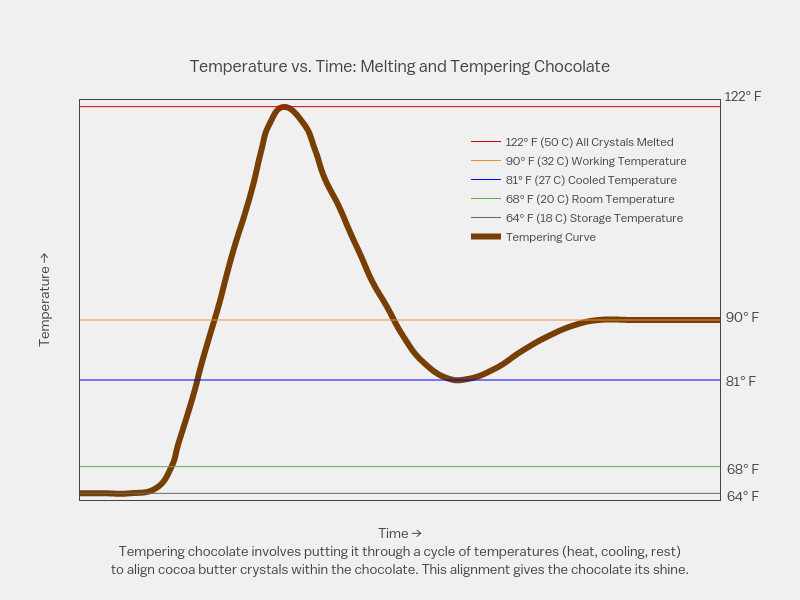
Cbplots's interactive graph and data of "Temperature vs. Time: Melting and Tempering Chocolate" is a line chart, showing Tempering Curve, 64° F (18 C) Storage Temperature , 68° F (20 C) Room Temperature, 81° F (27 C) Cooled Temperature, 90° F (32 C) Working Temperature, 122° F (50 C) All Crystals Melted; with Time →Tempering chocolate involves putting it through a cycle of temperatures (heat, cooling, rest)to align cocoa butter crystals within the chocolate. This alignment gives the chocolate its shine. in the x-axis and Temperature → in the y-axis.. The x-axis shows values from 0.026595744680851064 to 9.986702127659576. The y-axis shows values from 63 to 123. This visualization has the following annotations: 64° F; 68° F; 81° F; 90° F; 122° F