Edit chart
Loading graph
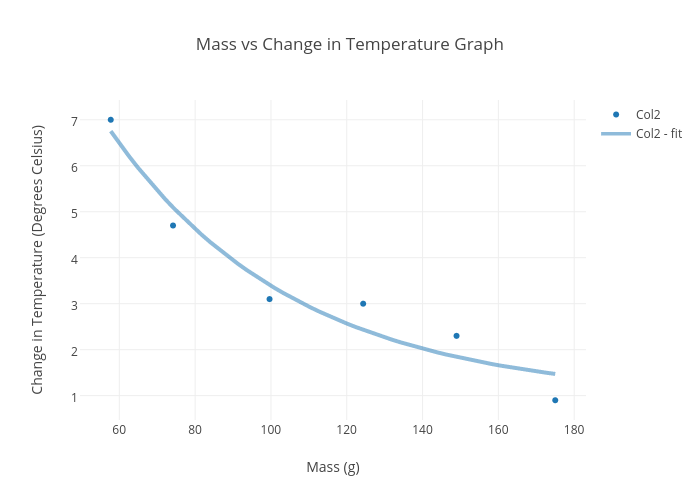
Btong's interactive graph and data of "Mass vs Change in Temperature Graph" is a scatter chart, showing Col2 vs Col2 - fit; with Mass (g) in the x-axis and Change in Temperature (Degrees Celsius) in the y-axis.. The x-axis shows values from 50.62943142996584 to 182.11056857003416. The y-axis shows values from 0.47192982456140353 to 7.428070175438597.