Edit chart
Loading graph
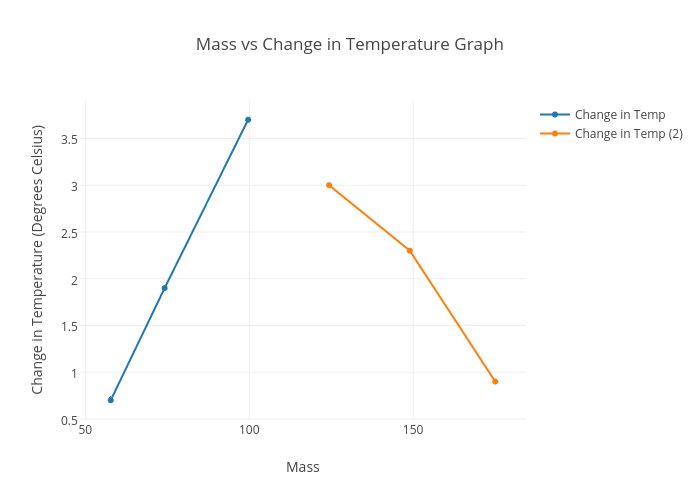
Btong's interactive graph and data of "Mass vs Change in Temperature Graph" is a scatter chart, showing Change in Temp vs Change in Temp (2); with Mass in the x-axis and Change in Temperature (Degrees Celsius) in the y-axis.. The x-axis shows values from 51.486147736298655 to 155.19385226370136. The y-axis shows values from 0.4894736842105263 to 3.9105263157894736.