Edit chart
Loading graph
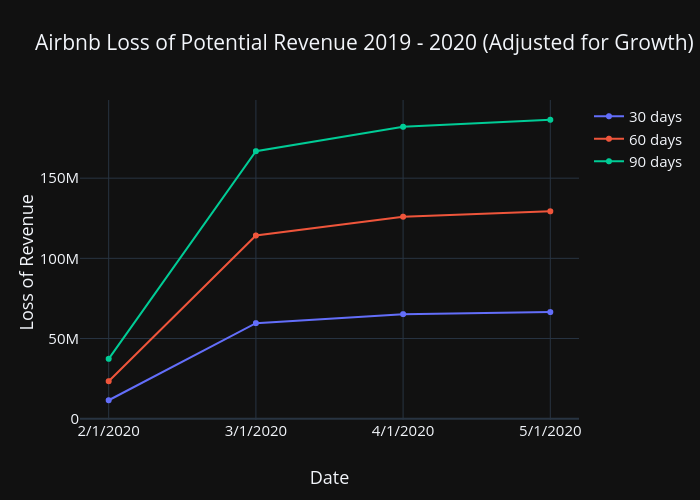
Brunnatorino's interactive graph and data of "Airbnb Loss of Potential Revenue 2019 - 2020 (Adjusted for Growth) " is a line chart, showing 30 days, 60 days, 90 days; with Date in the x-axis and Loss of Revenue in the y-axis.. The x-axis shows values from -0.18534289556252803 to 3.185342895562528. The y-axis shows values from -1229379.2219284028 to 199145210.84634984.