Edit chart
Loading graph
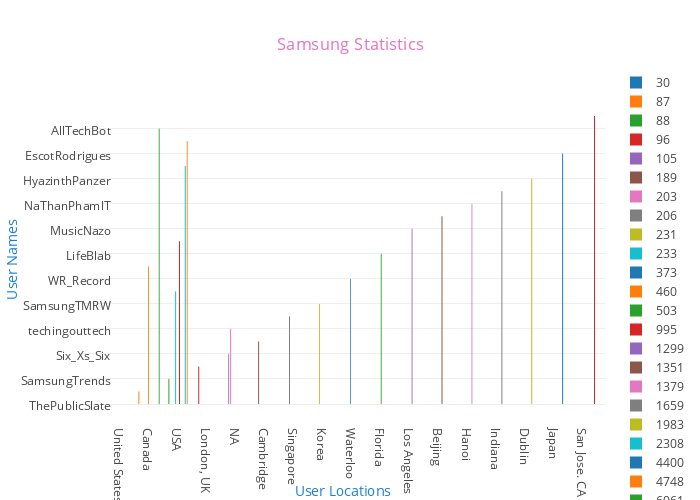
Bpm's interactive graph and data of "Samsung Statistics" is a grouped bar chart, showing 30, 87, 88, 96, 105, 189, 203, 206, 231, 233, 373, 460, 503, 995, 1299, 1351, 1379, 1659, 1983, 2308, 4400, 4748, 6061, 6302; with User Locations in the x-axis and User Names in the y-axis.. The x-axis shows values from -1.386503067484663 to 16.743353783231083. The y-axis shows values from -1.277777777777778 to 24.27777777777778.