Edit chart
Loading graph
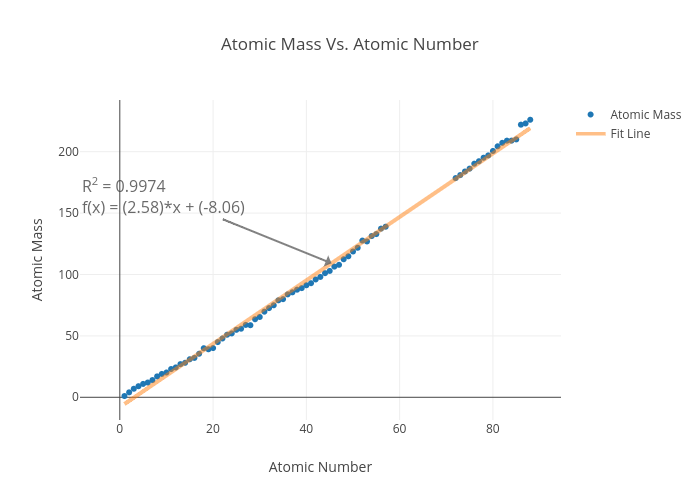
Bowhunter1's interactive graph and data of "Atomic Mass Vs. Atomic Number" is a scatter chart, showing Atomic Mass vs Fit Line; with Atomic Number in the x-axis and Atomic Mass in the y-axis.. The x-axis shows values from -4.27562225475842 to 93.27562225475842. The y-axis shows values from -18.503158668238072 to 242.032994011032. This visualization has the following annotation: R2 = 0.9974f(x) = (2.58)*x + (-8.06)