Edit chart
Loading graph
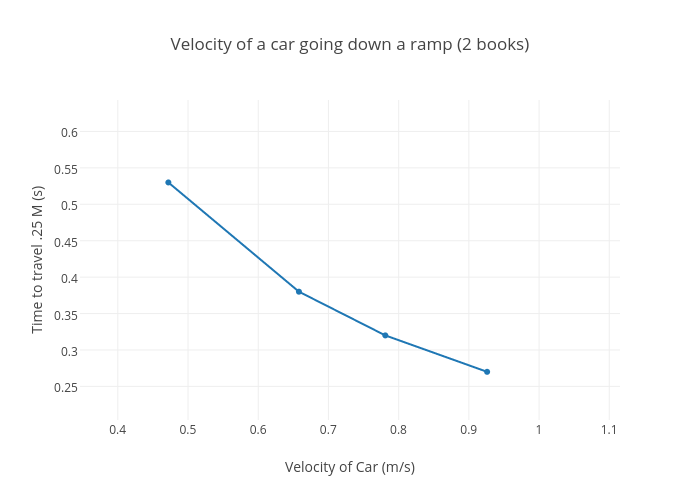
Bmechowski's interactive graph and data of "Velocity of a car going down a ramp (2 books)" is a scatter chart, showing Col2; with Velocity of Car (m/s) in the x-axis and Time to travel .25 M (s) in the y-axis.. The x-axis shows values from 0.3461716799273394 to 1.1152755993116559. The y-axis shows values from 0.2038476100231057 to 0.6431778312989969.