Edit chart
Loading graph
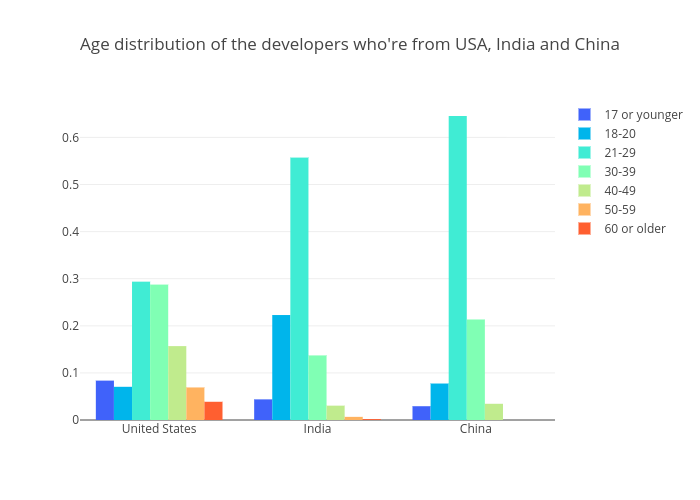
Bluekirin93's interactive graph and data of "Age distribution of the developers who're from USA, India and China" is a bar chart, showing 17 or younger, 18-20, 21-29, 30-39, 40-49, 50-59, 60 or older. The x-axis shows values from 0 to 0. The y-axis shows values from 0 to 0.