Edit chart
Loading graph
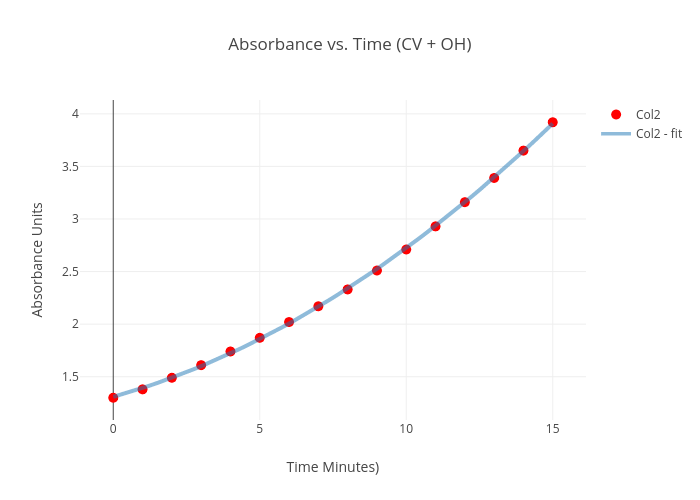
Biggin10's interactive graph and data of "Absorbance vs. Time (CV + OH)" is a scatter chart, showing Col2 vs Col2 - fit; with Time Minutes) in the x-axis and Absorbance Units in the y-axis.. The x-axis shows values from -1.0590639525564993 to 16.0590639525565. The y-axis shows values from 1.0739380530973452 to 4.1460619469026545.