Edit chart
Loading graph
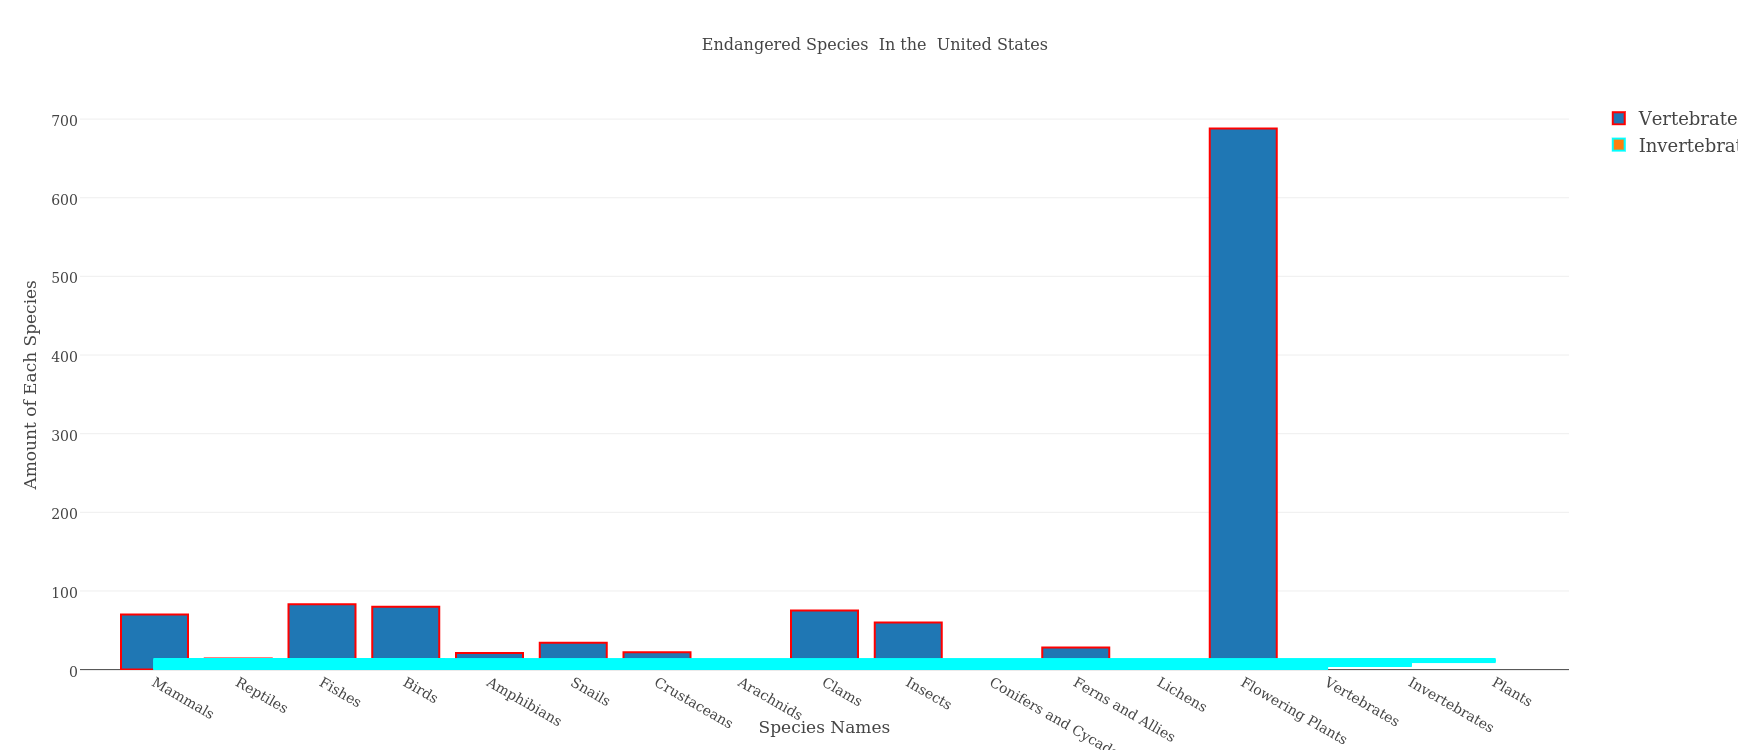
Bigfish320's interactive graph and data of " Endangered Species In the United States" is a grouped bar chart, showing Vertebrates, Invertebrates, Plants; with Species Names in the x-axis and Amount of Each Species in the y-axis.. The x-axis shows values from -0.5 to 13.5. The y-axis shows values from 0 to 724.2105263157895.