Edit chart
Loading graph
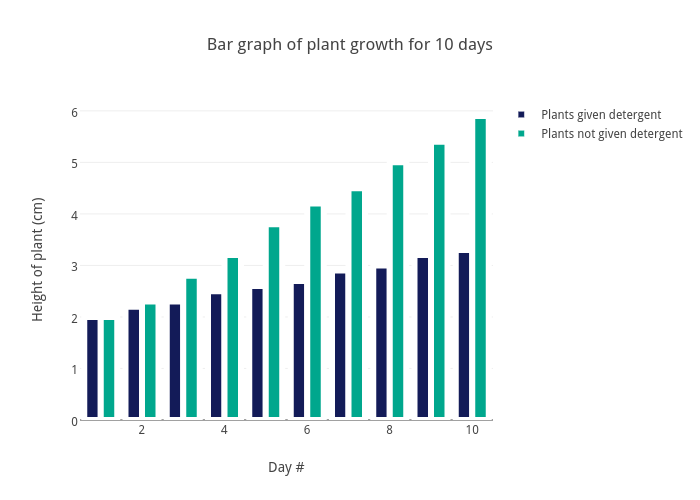
Benjamin.lifshey's interactive graph and data of "Bar graph of plant growth for 10 days" is a bar chart, showing Plants given detergent vs Plants not given detergent; with Day # in the x-axis and Height of plant (cm) in the y-axis.. The x-axis shows values from 0.5 to 10.5. The y-axis shows values from 0 to 6.210526315789474.