Edit chart
Loading graph
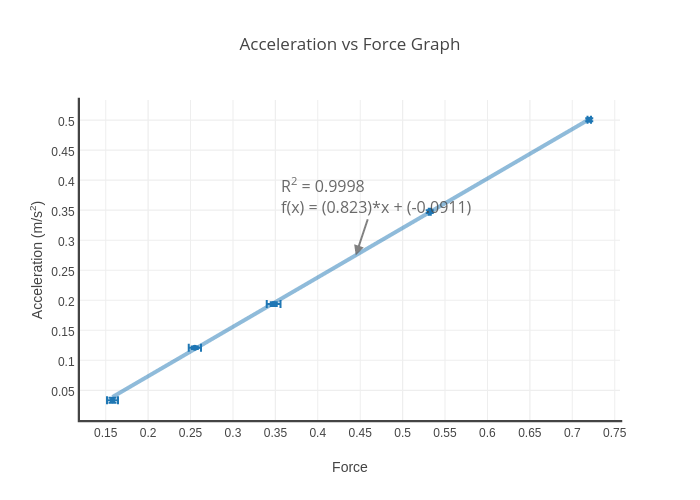
Bdincerol's interactive graph and data of "Acceleration vs Force Graph" is a scatter chart, showing Col2 vs Col2 - fit; with Force in the x-axis and Acceleration (m/s2) in the y-axis.. The x-axis shows values from 0.11974168011350202 to 0.7551300778434618. The y-axis shows values from 0.00102733249581239 to 0.5330276675041876. This visualization has the following annotation: R2 = 0.9998f(x) = (0.823)*x + (-0.0911)