Edit chart
Loading graph
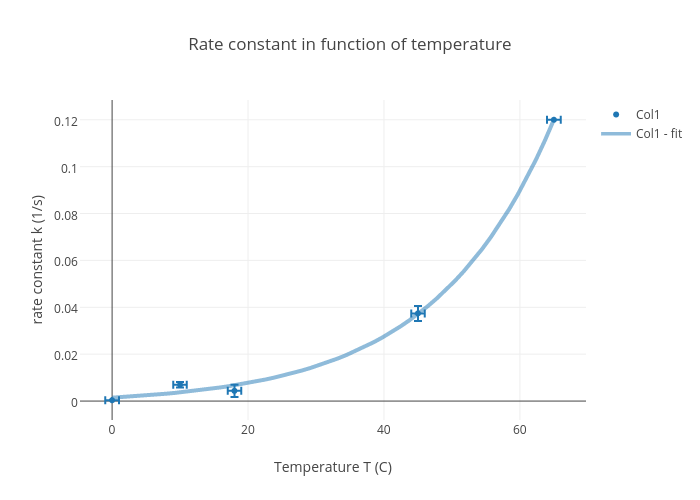
Ayoub's interactive graph and data of "Rate constant in function of temperature" is a scatter chart, showing Col1 vs Col1 - fit; with Temperature T (C) in the x-axis and rate constant k (1/s) in the y-axis.. The x-axis shows values from -4.722222222222223 to 69.72222222222223. The y-axis shows values from -0.008098732213795593 to 0.1284477322137956.