Edit chart
Loading graph
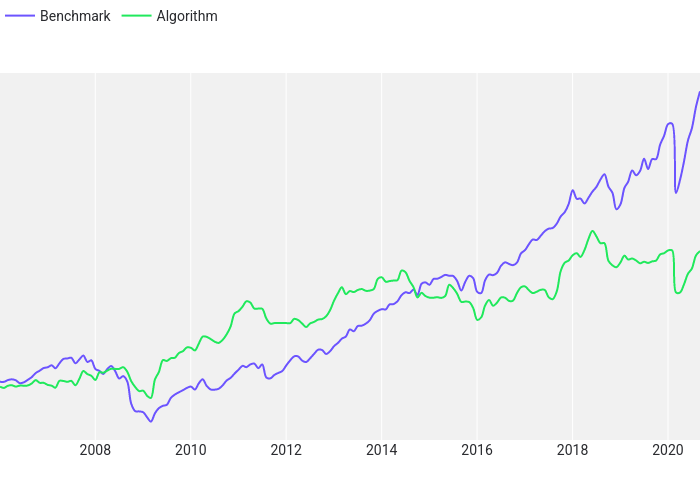
Ayako0's interactive graph and data of "" is a line chart, showing Benchmark vs Algorithm; with in the x-axis and in the y-axis.. The x-axis shows values from 2006-01-02 to 2020-09-02. The y-axis shows values from -84.69524208017698 to -31.542789334099314.