Edit chart
Loading graph
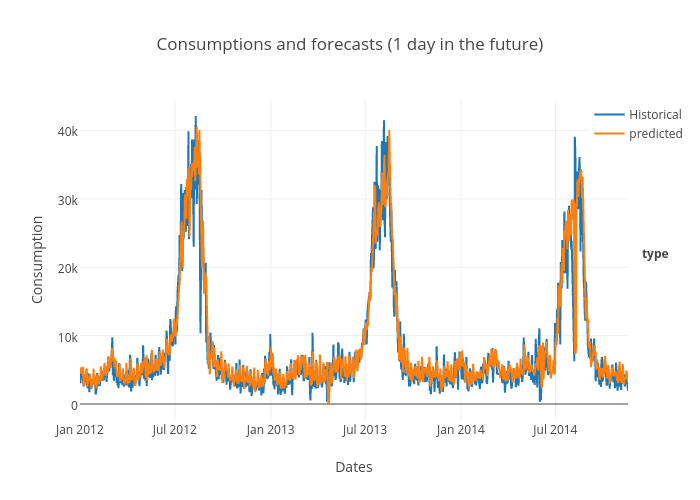
Avh's interactive graph and data of "Consumptions and forecasts (1 day in the future)" is a line chart, showing Historical vs predicted; with Dates in the x-axis and Consumption in the y-axis.. The x-axis shows values from 1325372400000 to 1416178800000. The y-axis shows values from -2339.444444444445 to 44449.444444444445. This visualization has the following annotation: type