Edit chart
Loading graph
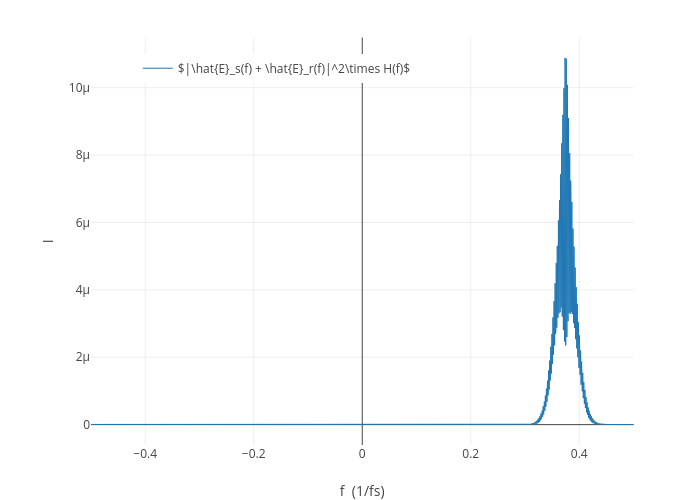
Austinspencer's interactive graph and data of "" is a line chart, showing $|\hat{E}_s(f) + \hat{E}_r(f)|^2\times H(f)$; with f (1/fs) in the x-axis and I in the y-axis.. The x-axis shows values from -0.5 to 0.5. The y-axis shows values from -6.047131584746668e-07 to 1.1489550011018668e-05.