Edit chart
Loading graph
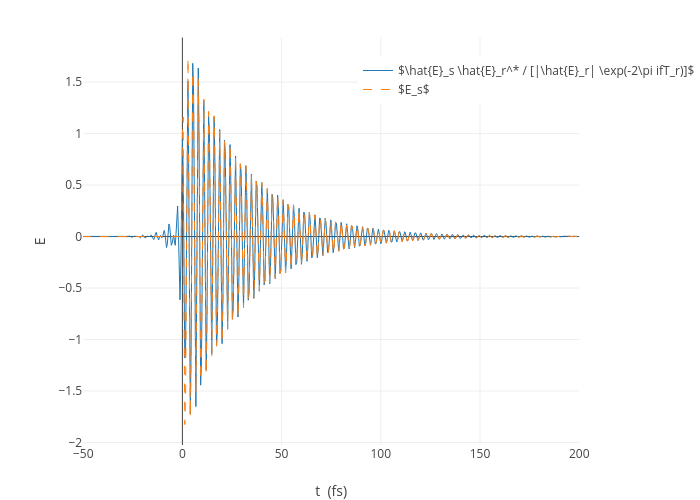
Austinspencer's interactive graph and data of "" is a line chart, showing $\hat{E}_s \hat{E}_r^* / [|\hat{E}_r| \exp(-2\pi ifT_r)]$ vs $E_s$; with t (fs) in the x-axis and E in the y-axis.. The x-axis shows values from -50 to 200. The y-axis shows values from -2.0242280039416687 to 1.9330296264187088. This visualization has the following annotation: