Edit chart
Loading graph
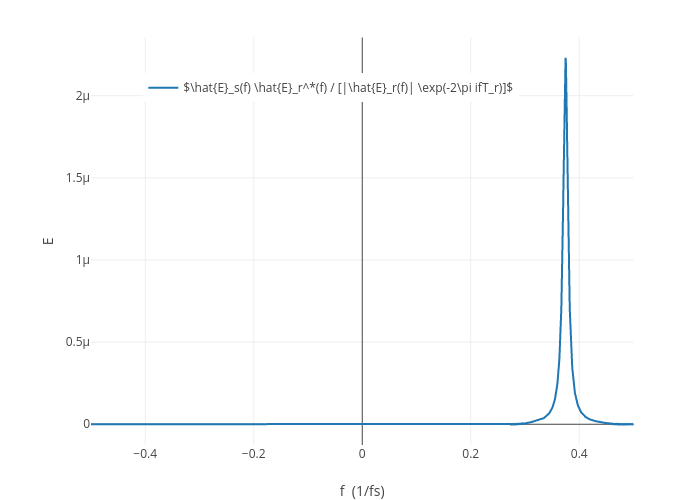
Austinspencer's interactive graph and data of "" is a line chart, showing $\hat{E}_s(f) \hat{E}_r^*(f) / [|\hat{E}_r(f)| \exp(-2\pi ifT_r)]$; with f (1/fs) in the x-axis and E in the y-axis.. The x-axis shows values from -0.5 to 0.5. The y-axis shows values from -1.262879643899939e-07 to 2.354277634859747e-06.