Edit chart
Loading graph
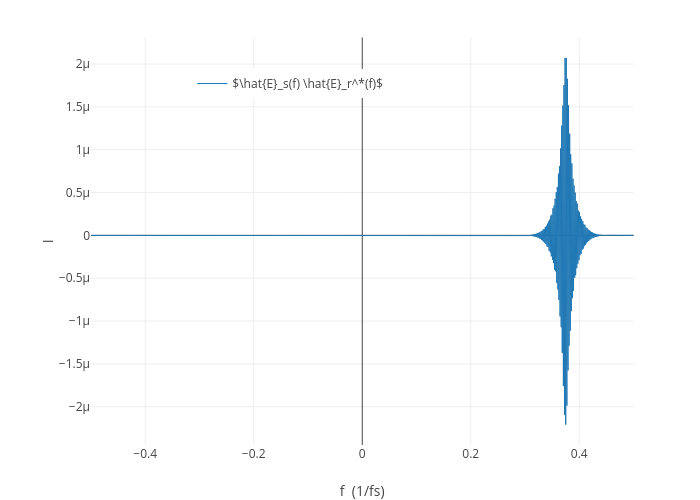
Austinspencer's interactive graph and data of "" is a line chart, showing $\hat{E}_s(f) \hat{E}_r^*(f)$; with f (1/fs) in the x-axis and I in the y-axis.. The x-axis shows values from -0.5 to 0.5. The y-axis shows values from -2.4466023047284025e-06 to 2.309462075858653e-06.