Edit chart
Loading graph
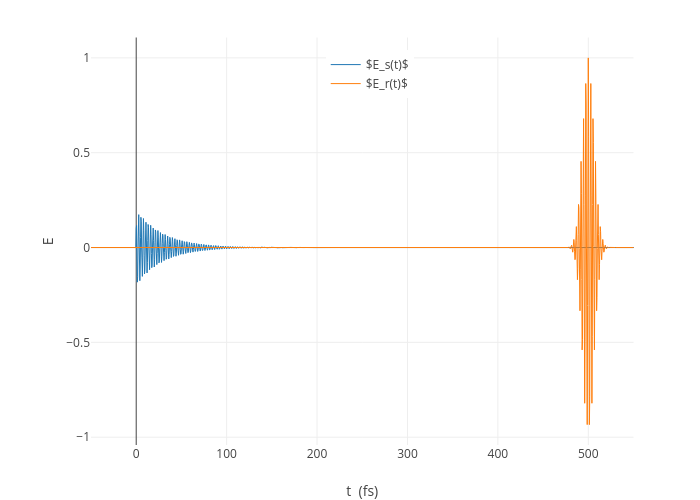
Austinspencer's interactive graph and data of "" is a line chart, showing $E_s(t)$ vs $E_r(t)$; with t (fs) in the x-axis and E in the y-axis.. The x-axis shows values from -50 to 550. The y-axis shows values from -1.0411633209221034 to 1.1074296484695845. This visualization has the following annotation: