Edit chart
Loading graph
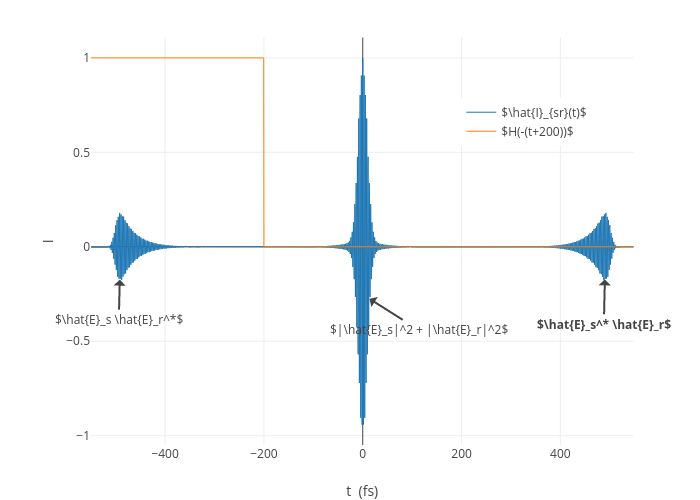
Austinspencer's interactive graph and data of "" is a line chart, showing $\hat{I}_{sr}(t)$ vs $H(-(t+200))$; with t (fs) in the x-axis and I in the y-axis.. The x-axis shows values from -550 to 548. The y-axis shows values from -1.0492313018762789 to 1.1078542790461199. This visualization has the following annotations: $\hat{E}_s \hat{E}_r^*$; $\hat{E}_s^* \hat{E}_r$; $|\hat{E}_s|^2 + |\hat{E}_r|^2$