Edit chart
Loading graph
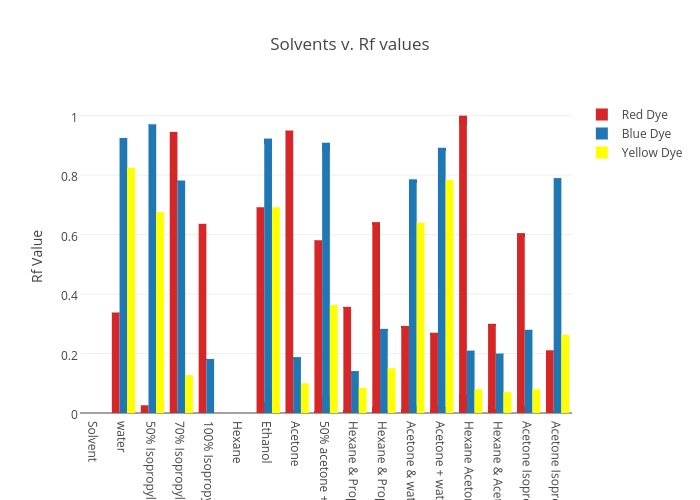
Arvizuj11's interactive graph and data of "Solvents v. Rf values" is a bar chart, showing Red Dye, Blue Dye, Yellow Dye; with Rf Value in the y-axis. The x-axis shows values from 0.5 to 16.5. The y-axis shows values from 0 to 1.0526315789473684.