Edit chart
Loading graph
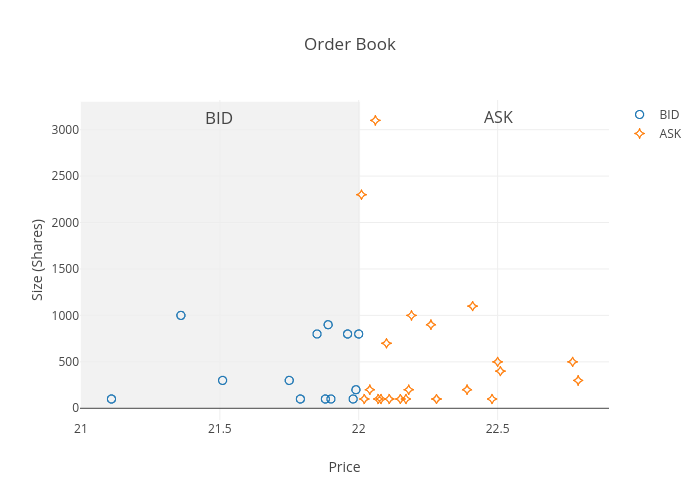
Arunvs's interactive graph and data of "Order Book" is a scatter chart, showing BID vs ASK; with Price in the x-axis and Size (Shares) in the y-axis.. The x-axis shows values from 21 to 22.89478748997594. The y-axis shows values from -116.19197129401215 to 3310.5853330343125. This visualization has the following annotations: BID; ASK