Edit chart
Loading graph
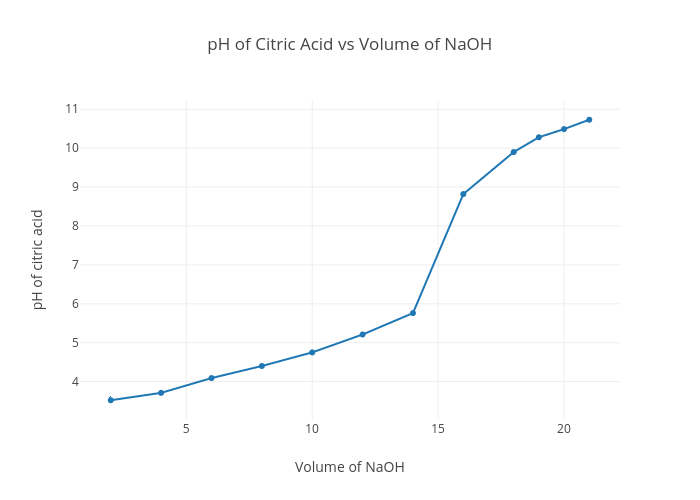
Ardenberzon's interactive graph and data of "pH of Citric Acid vs Volume of NaOH" is a scatter chart, showing Col2; with Volume of NaOH in the x-axis and pH of citric acid in the y-axis.. The x-axis shows values from 0.8189026324135742 to 22.181097367586425. The y-axis shows values from 2.984668012561687 to 11.265331987438314.