Edit chart
Loading graph
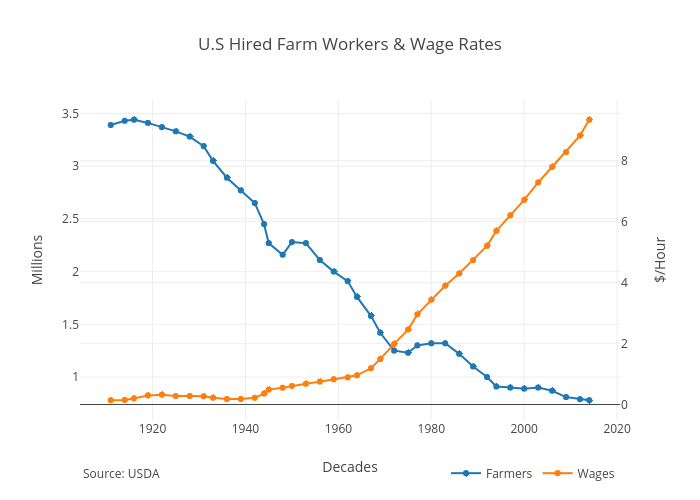
Angelocanepacom's interactive graph and data of "U.S Hired Farm Workers & Wage Rates" is a line chart, showing Farmers vs Wages; with Decades in the x-axis and Millions in the y-axis.. The x-axis shows values from 1904-08-25 01:34:55.3806 to 2020-05-08 22:25:04.6194. The y-axis shows values from 0.5947532116294794 to 3.6252467883705206. This visualization has the following annotation: Source: USDA