Edit chart
Loading graph
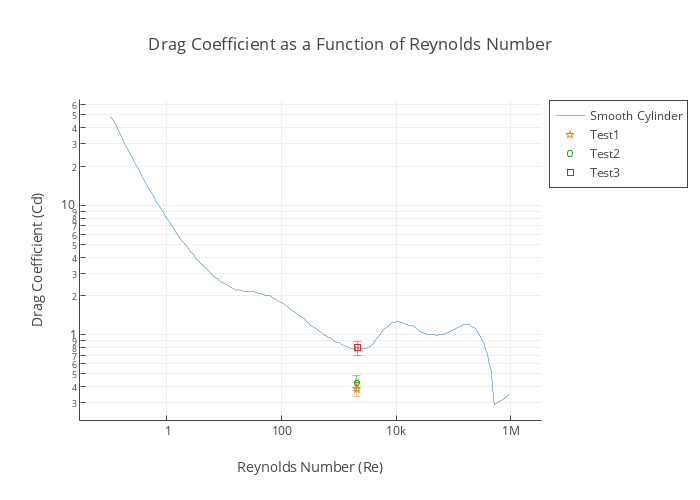
Amruthwo's interactive graph and data of "Drag Coefficient as a Function of Reynolds Number" is a line chart, showing Smooth Cylinder, Test1, Test2, Test3; with Reynolds Number (Re) in the x-axis and Drag Coefficient (Cd) in the y-axis.. The x-axis shows values from -1.3954753951449455 to 6.387668993950246. The y-axis shows values from -0.6568215971877526 to 1.814591072328793.