Edit chart
Loading graph
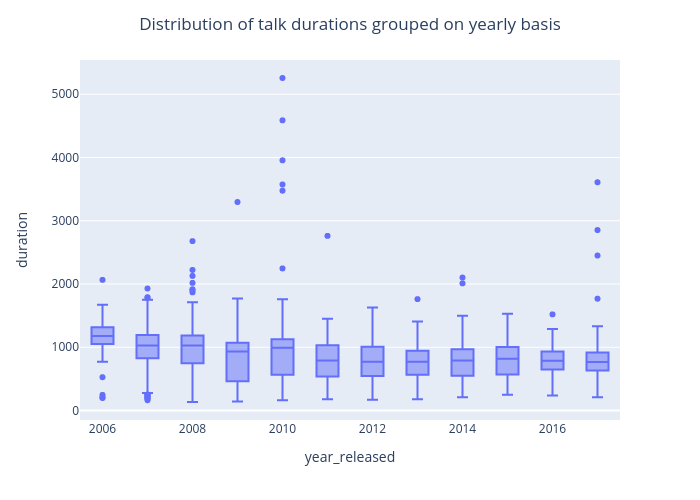
Amnagul's interactive graph and data of "Distribution of talk durations grouped on yearly basis" is a box plot; with year_released in the x-axis and duration in the y-axis.. The x-axis shows values from 0 to 0. The y-axis shows values from 0 to 0.