Edit chart
Loading graph
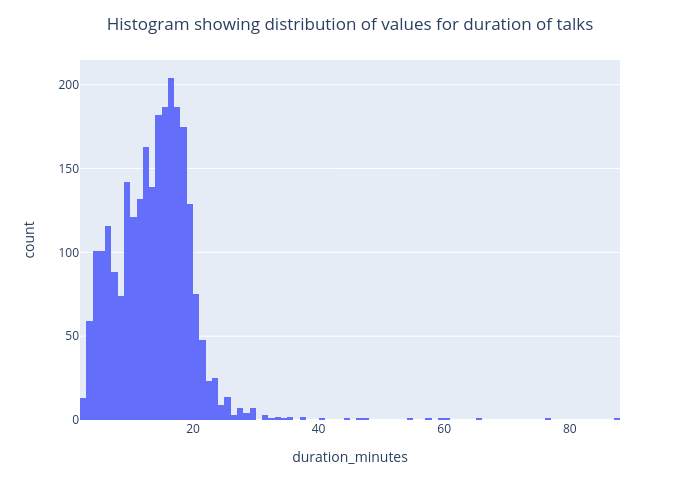
Amnagul's interactive graph and data of "Histogram showing distribution of values for duration of talks" is a histogram; with duration_minutes in the x-axis and count in the y-axis.. The x-axis shows values from 0 to 0. The y-axis shows values from 0 to 0.