Edit chart
Loading graph
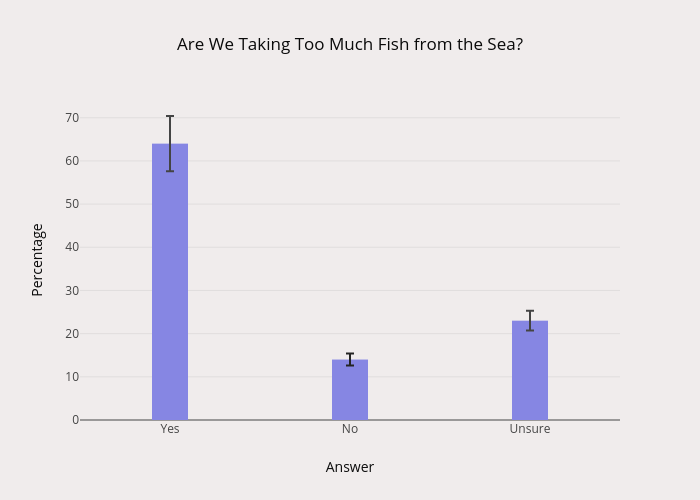
Allylafayette's interactive graph and data of "Are We Taking Too Much Fish from the Sea?" is a bar chartwith vertical error bars; with Answer in the x-axis and Percentage in the y-axis.. The x-axis shows values from -0.5 to 2.5. The y-axis shows values from 0 to 74.10526315789474.