Edit chart
Loading graph
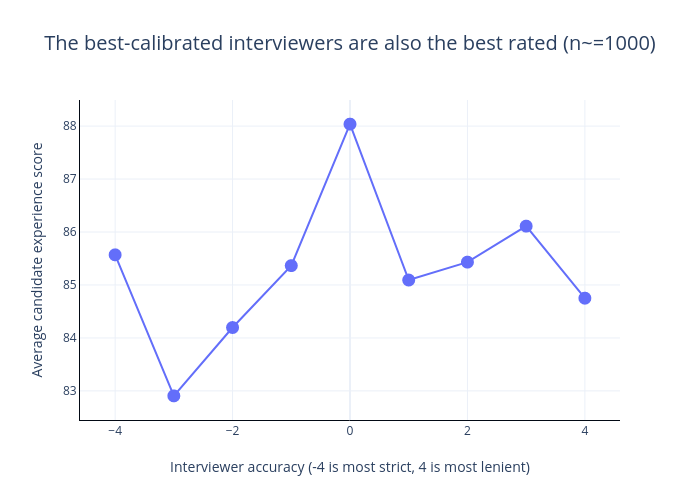
Aline_interviewingio's interactive graph and data of "The best-calibrated interviewers are also the best rated (n~=1000)" is a ; with Interviewer accuracy (-4 is most strict, 4 is most lenient) in the x-axis and Average candidate experience score in the y-axis.. The x-axis shows values from -4.544634806131651 to 4.544634806131651. The y-axis shows values from 82.46776291332314 to 88.47557287667686.