Edit chart
Loading graph
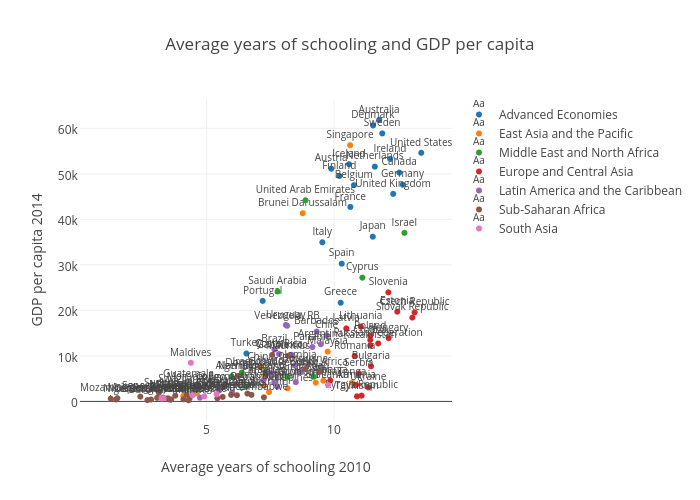
Alexandre.afonso's interactive graph and data of "Average years of schooling and GDP per capita" is a , showing Advanced Economies, East Asia and the Pacific, Middle East and North Africa, Europe and Central Asia, Latin America and the Caribbean, Sub-Saharan Africa, South Asia; with Average years of schooling 2010 in the x-axis and GDP per capita 2014 in the y-axis.. The x-axis shows values from 0.2520066518847006 to 14.4079933481153. The y-axis shows values from -4267.793808148652 to 66409.79716774865.