Edit chart
Loading graph
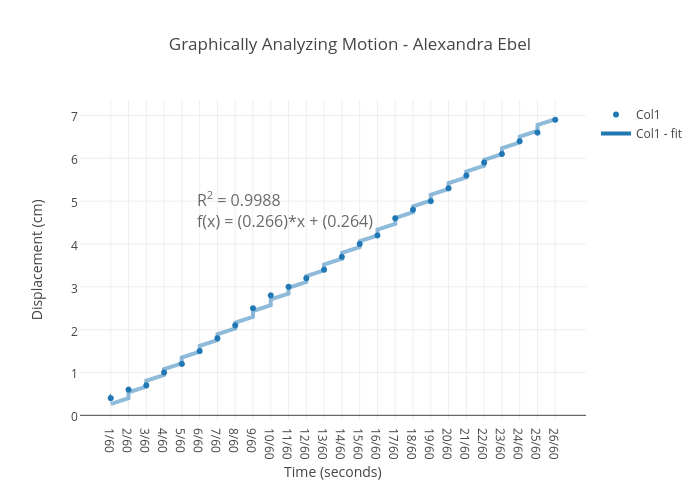
Alexandra.ebel's interactive graph and data of "Graphically Analyzing Motion - Alexandra Ebel" is a scatter chart, showing Col1 vs Col1 - fit; with Time (seconds) in the x-axis and Displacement (cm) in the y-axis.. The x-axis shows values from -1.5159834065397757 to 26.515983406539775. The y-axis shows values from -0.10903897053629519 to 7.353791722240921. This visualization has the following annotation: R2 = 0.9988f(x) = (0.266)*x + (0.264)