Edit chart
Loading graph
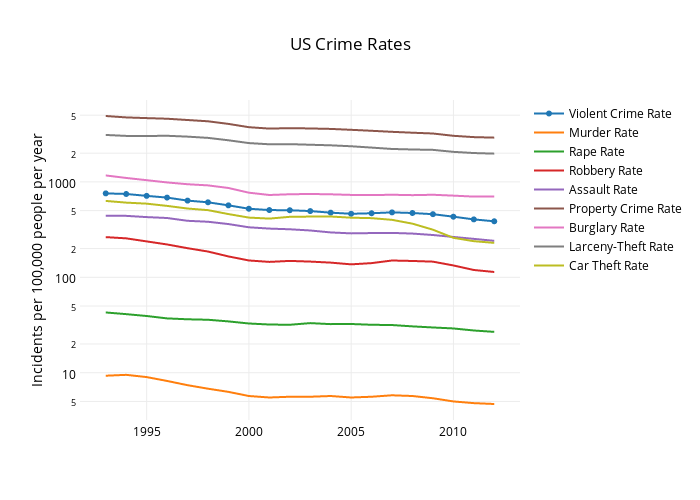
Alex's interactive graph and data of "US Crime Rates" is a line chart, showing Violent Crime Rate, Murder Rate, Rape Rate, Robbery Rate, Assault Rate, Property Crime Rate, Burglary Rate, Larceny-Theft Rate, Car Theft Rate; with time in the x-axis and Incidents per 100,000 people per year in the y-axis.. The x-axis shows values from 690054073733.5248 to 1361031526266.475. The y-axis shows values from 0.5044075226583911 to 3.858214228204916.