Edit chart
Loading graph
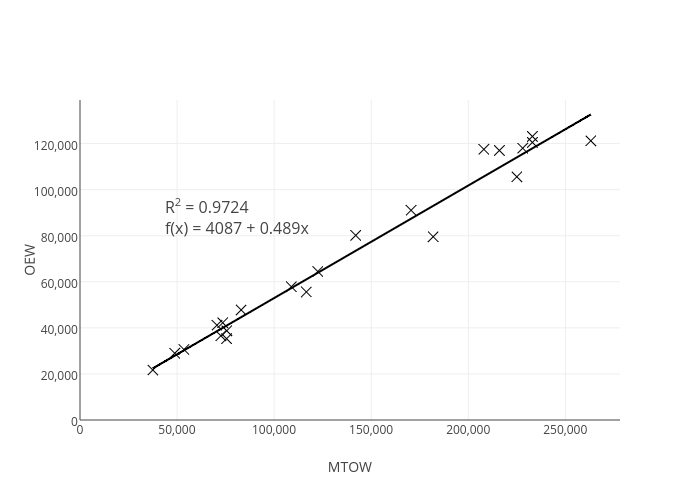
Aleksanndar1995's interactive graph and data of "OEW vs MTOW" is a scatter chart, showing vs OEW - fit; with MTOW in the x-axis and OEW in the y-axis.. The x-axis shows values from 0 to 278121.5960677749. The y-axis shows values from 0 to 138913.31528164173. This visualization has the following annotation: R2 = 0.9724f(x) = 4087 + 0.489x