Edit chart
Loading graph
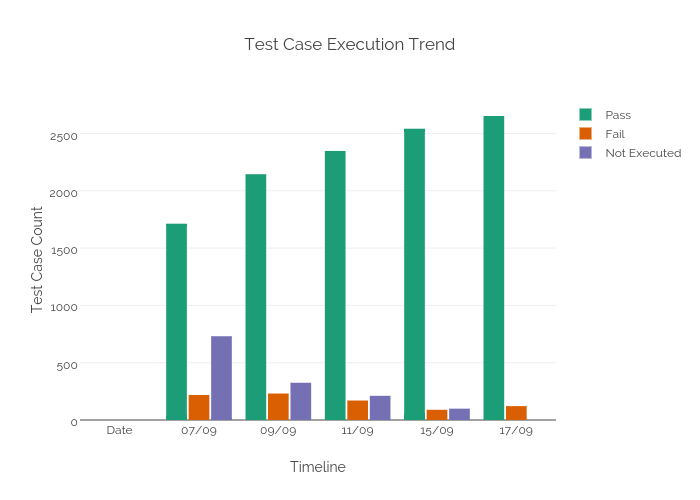
Akshayt0444's interactive graph and data of "Test Case Execution Trend" is a bar chart, showing Pass, Fail, Not Executed; with Timeline in the x-axis and Test Case Count in the y-axis.. The x-axis shows values from -0.5 to 5.5. The y-axis shows values from 0 to 2792.6315789473683.