2
3
4
5
6
7
8
9
10
11
12
13
0
1.75
3.5
5.25
7
8.75
10.5
12.25
pH Values
d(pH)/dV
d(pH)/dV Gaussian Fit
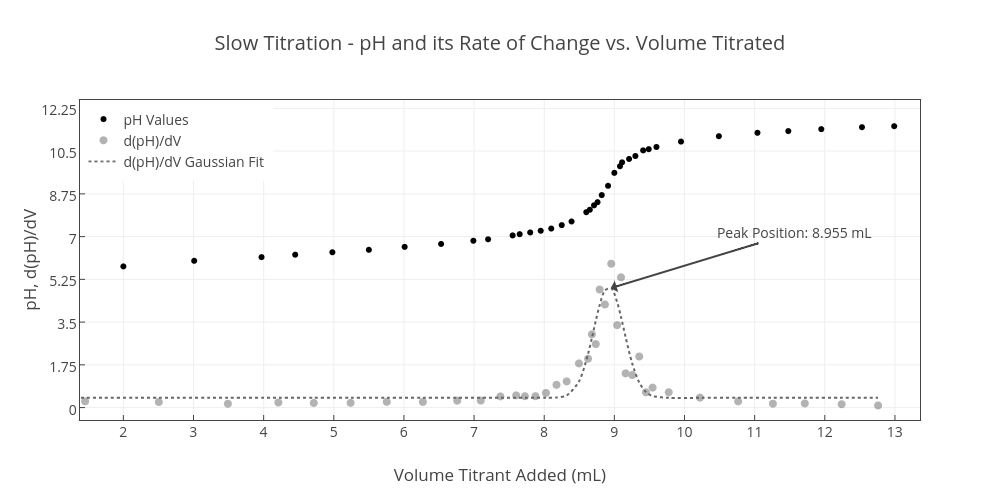
Slow Titration - pH and its Rate of Change vs. Volume Titrated
Volume Titrant Added (mL)
pH, d(pH)/dV
Peak Position: 8.955 mL
plotly-logomark
Edit chart
Akline96's interactive graph and data of "Slow Titration - pH and its Rate of Change vs. Volume Titrated" is a scatter chart, showing pH Values, d(pH)/dV, d(pH)/dV Gaussian Fit; with Volume Titrant Added (mL) in the x-axis and pH, d(pH)/dV in the y-axis.. The x-axis shows values from 1.3819017216917437 to 13.357320602771729. The y-axis shows values from -0.5084582401550877 to 12.5929702756665. This visualization has the following annotation: Peak Position: 8.955 mL