Edit chart
Loading graph
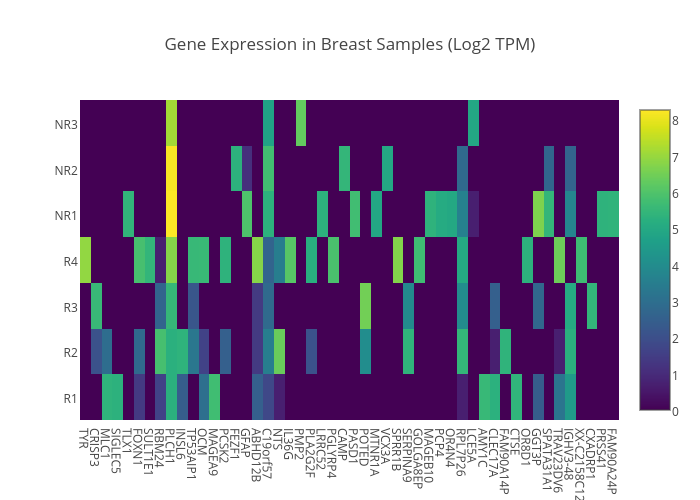
Ahosny's interactive graph and data of "Gene Expression in Breast Samples (Log2 TPM)" is a heatmap. The x-axis shows values from 0 to 0. The y-axis shows values from 0 to 0.