Edit chart
Loading graph
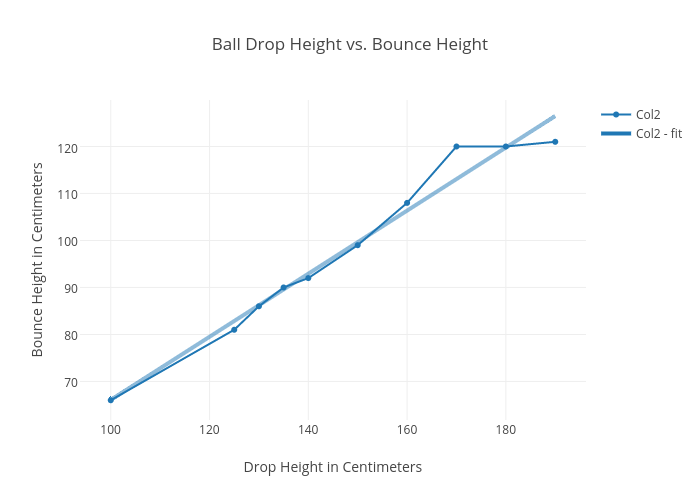
Aeouellette's interactive graph and data of "Ball Drop Height vs. Bounce Height" is a scatter chart, showing Col2 vs Col2 - fit; with Drop Height in Centimeters in the x-axis and Bounce Height in Centimeters in the y-axis.. The x-axis shows values from 94.21049018261705 to 195.78950981738294. The y-axis shows values from 61.79433057449075 to 129.89628726167095.