Edit chart
Loading graph
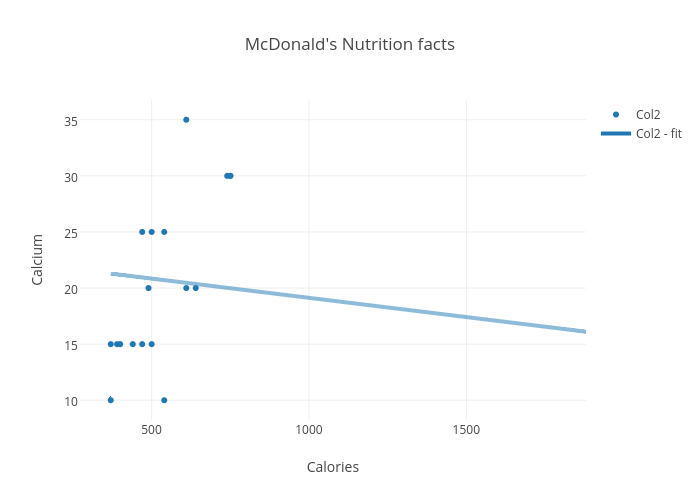
Abathingyeezy's interactive graph and data of "McDonald's Nutrition facts" is a scatter chart, showing Col2 vs Col2 - fit; with Calories in the x-axis and Calcium in the y-axis.. The x-axis shows values from 274.0072758663214 to 1975.9927241336786. The y-axis shows values from 6.0937161430119176 to 36.90628385698808.