Edit chart
Loading graph
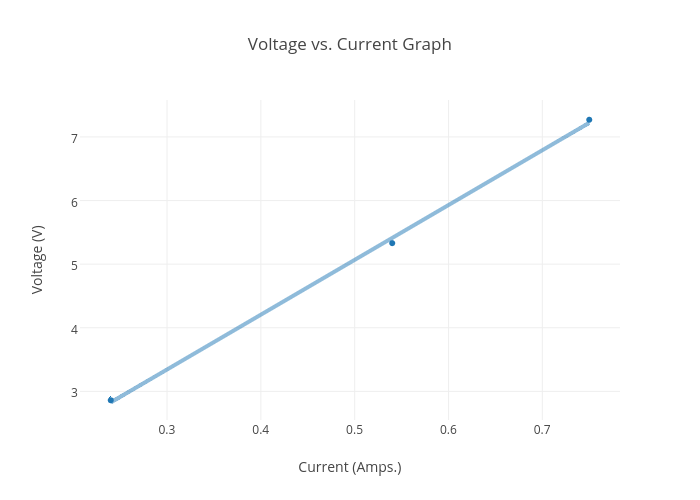
Aaron35's interactive graph and data of "Voltage vs. Current Graph" is a scatter chart, showing Voltage (V) vs Voltage (V) - fit; with Current (Amps.) in the x-axis and Voltage (V) in the y-axis.. The x-axis shows values from 0.2078808123997862 to 0.7821191876002138. The y-axis shows values from 2.576307643714466 to 7.553692356285533.