Edit chart
Loading graph
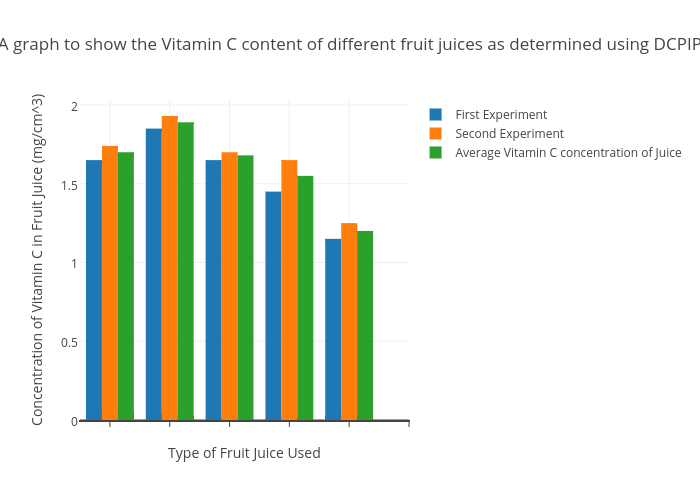
A.alhasani11's interactive graph and data of "A graph to show the Vitamin C content of different fruit juices as determined using DCPIP" is a bar chart, showing First Experiment, Second Experiment, Average Vitamin C concentration of Juice; with Type of Fruit Juice Used in the x-axis and Concentration of Vitamin C in Fruit Juice (mg/cm^3) in the y-axis.. The x-axis shows values from -0.5 to 5. The y-axis shows values from 0 to 2.031578947368421.