Edit chart
Loading graph
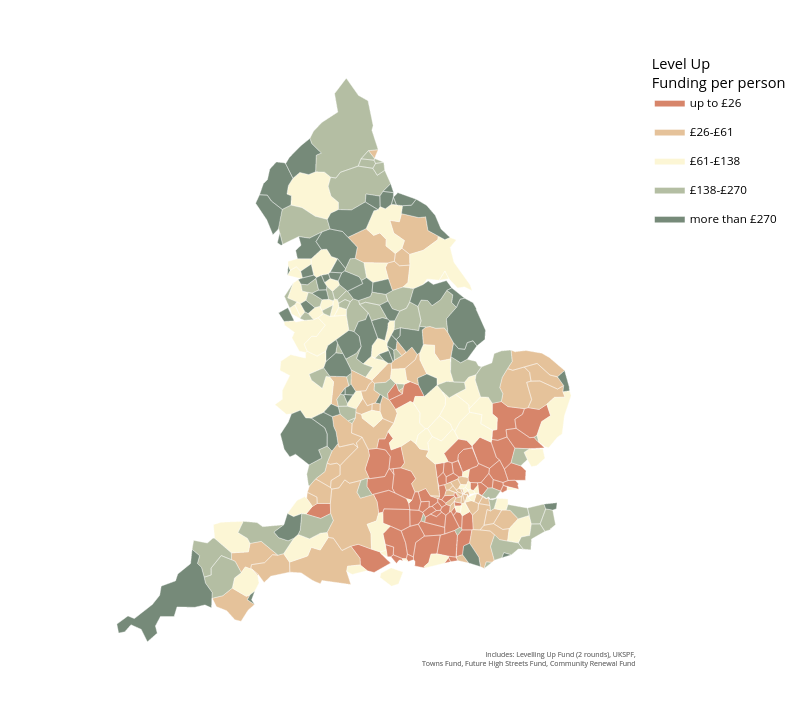
A.alexiou's interactive graph and data of "up to £26, £26-£61, £61-£138, £138-£270, more than £270" is a line chart, showing up to £26, £26-£61, £61-£138, £138-£270, more than £270. The x-axis shows values from 108899.51303999999 to 681680.28776. The y-axis shows values from -20789.188480000004 to 689850.04368. This visualization has the following annotations: Includes: Levelling Up Fund (2 rounds), UKSPF,Towns Fund, Future High Streets Fund, Community Renewal Fund; Includes: Levelling Up Fund (2 rounds), UKSPF,Towns Fund, Future High Streets Fund, Community Renewal Fund