Edit chart
Loading graph
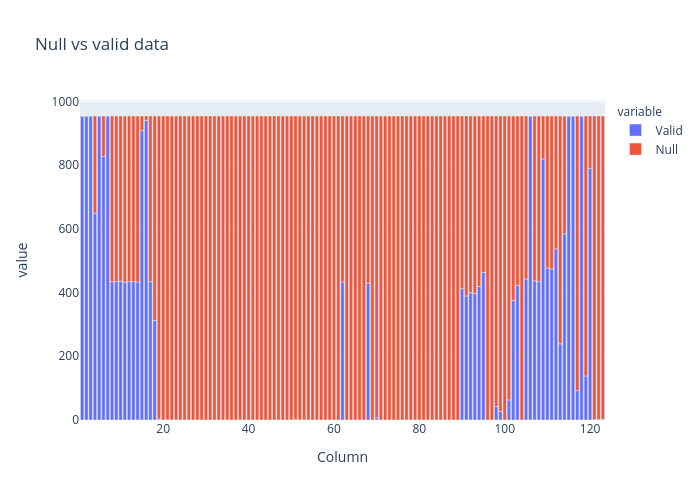
A.acharya's interactive graph and data of "Null vs valid data" is a , showing Valid vs Null; with Column in the x-axis and value in the y-axis.. The x-axis shows values from 0 to 0. The y-axis shows values from 0 to 0.