Edit chart
Loading graph
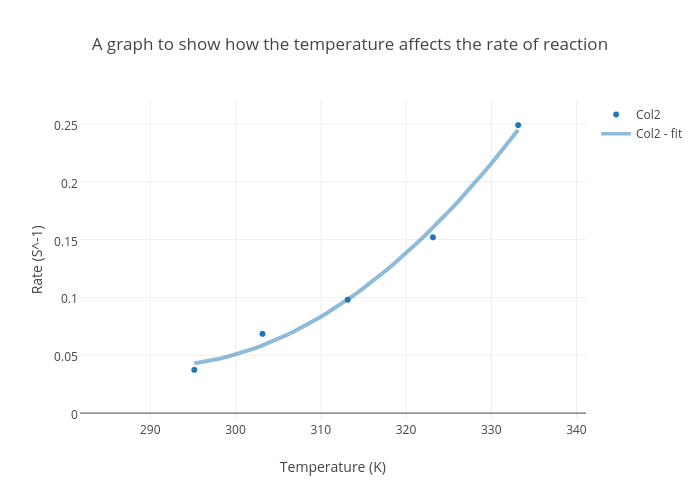
_mat_'s interactive graph and data of "A graph to show how the temperature affects the rate of reaction" is a scatter chart, showing Col2 vs Col2 - fit; with Temperature (K) in the x-axis and Rate (S^-1) in the y-axis.. The x-axis shows values from 281.73924989326025 to 341.10917079972387. The y-axis shows values from -0.005953880535423542 to 0.27070718346690287.