Edit chart
Loading graph
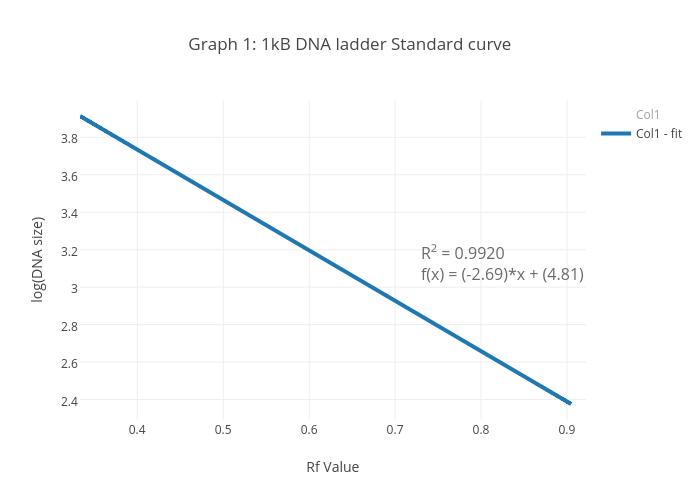
Yige's interactive graph and data of "Graph 1: 1kB DNA ladder Standard curve" is a , showing Col1 vs Col1 - fit; with Rf Value in the x-axis and log(DNA size) in the y-axis.. The x-axis shows values from 0.33333333330000003 to 0.9047619048. The y-axis shows values from 2.290561483918815 to 3.999536315888795. This visualization has the following annotation: R2 = 0.9920f(x) = (-2.69)*x + (4.81)