Edit chart
Loading graph
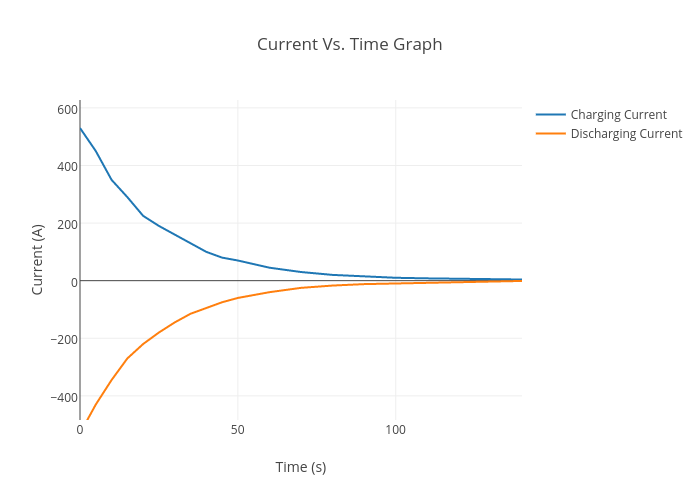
Ufroman's interactive graph and data of "Current Vs. Time Graph" is a scatter chart, showing Charging Current vs Discharging Current; with Time (s) in the x-axis and Current (A) in the y-axis.. The x-axis shows values from 0 to 140. The y-axis shows values from -483.8116261957322 to 627.2994849153789.