Edit chart
Loading graph
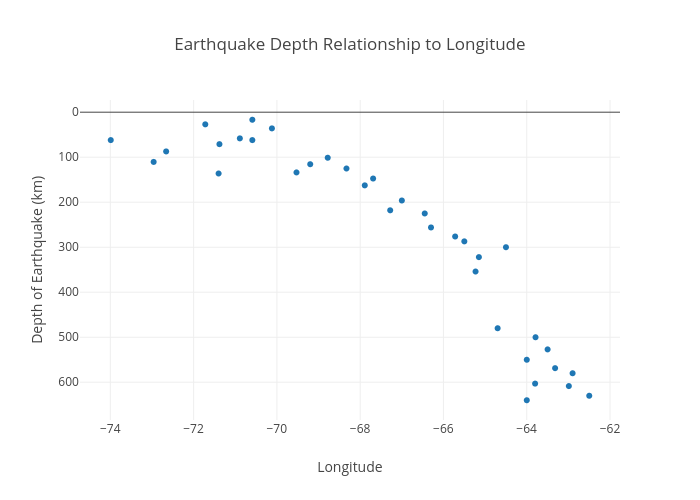
Trungjames's interactive graph and data of "Earthquake Depth Relationship to Longitude" is a scatter chart, showing Col2; with Longitude in the x-axis and Depth of Earthquake (km) in the y-axis.. The x-axis shows values from -74.68417074877536 to -61.80582925122463. The y-axis shows values from 682.7115264797508 to -25.91152647975078.